For #TidyTuesday - Board games
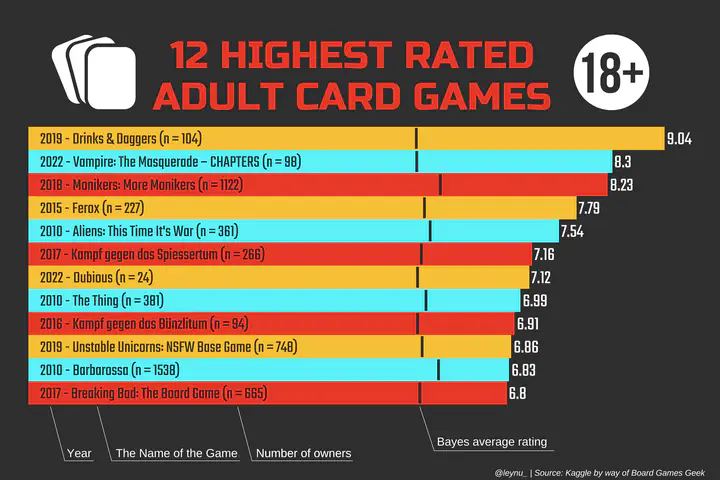
The data this week comes from Kaggle by way of Board Games Geek, with a hattip to David and Georgios .
## ---------------------------
## TidyTuesday 2022-01-25 (Week 4)
##
## Author: Leyla Nunez
## Date Created: 2022-01-26
## ---------------------------

# Libraries
library(here)
library(tidyverse)
library(stringr)
library(tidyr)
library(forcats)
library(showtext)
library(cowplot)

# Adds
showtext_auto()
font_add_google("Teko")
font_add_google("Russo One")
font1 <- "Teko"
font2 <- "Russo One"

ratings <- readr::read_csv('https://raw.githubusercontent.com/rfordatascience/tidytuesday/master/data/2022/2022-01-25/ratings.csv')
details <- readr::read_csv('https://raw.githubusercontent.com/rfordatascience/tidytuesday/master/data/2022/2022-01-25/details.csv')

# Cleaning
remove <- c("'", "\\[", "\\]", '\\"')
details$boardgamecategory2 <- str_remove_all(details$boardgamecategory, paste(remove, collapse = "|"))
nmax <- max(stringr::str_count(details$boardgamecategory2, ","), na.rm = TRUE) + 1
nmax
details2 <- details %>%
  select(id, owned, minage, boardgamecategory, boardgamecategory2) %>%
  separate(., boardgamecategory2, paste0("col", seq_len(nmax)),
                                  sep = ",",
                                  fill = "right") %>%
  gather(., col_vari, category, col1:col14) %>%
  filter(!is.na(category)) %>%
  mutate(category = trimws(category)) %>%
  group_by(category) %>%
  mutate(count = n()) %>%
  ungroup() %>%
  filter(category == "Card Game") %>% #Just keeping gard games
  select(-col_vari) %>%
  filter(minage >= 18)

a <- details2  %>%
  left_join(ratings, by = c("id")) %>%
  filter(!is.na(bayes_average) & bayes_average > 0) %>%
  arrange(-average) %>%
  slice(1:12) %>%
  arrange(desc(average)) %>%
  mutate(condition = paste0(LETTERS[1:12], average),
         name_new = paste0(year, " - ",name, " (n = ", owned, ")"))

# colors used
my_colors<- c(
  '#f9ca47', '#69f2fa', '#ee5034',
  '#f9ca47', '#69f2fa', '#ee5034',
  '#f9ca47', '#69f2fa', '#ee5034',
  '#f9ca47', '#69f2fa', '#ee5034')

# Plot
p <- ggplot(data=a, aes(x=reorder(name_new, average), y=average, fill=condition)) +
  geom_bar(stat="identity",
           width = 1) +
  geom_errorbar(aes(y = bayes_average, ymin = bayes_average, ymax = bayes_average),
                color="#3d3d3d",
                size =1.5) +
  geom_text(aes(label = average),
            color = "white",
            size = 8,
            hjust = -0.1,
            vjust = 0.5,
            family=font1) +
  coord_cartesian(ylim = c(0, 14), # This focuses the x-axis on the range of interest
                  clip = 'off') +   # This keeps the labels from disappearing
  coord_flip() +
  labs(title = "  12 HIGHEST RATED \n ADULT CARD GAMES",
       subtitle = " "
       ) +
  theme_minimal() +
  theme(plot.margin = margin(1.75, 1, 3, 1, "cm"),
        plot.background = element_rect(fill="#3d3d3d",
                                       color="#3d3d3d"),
        plot.title = element_text(size = 46,
                                  hjust = 0.5,
                                  family=font2,
                                  face = "bold",
                                  color="#ee5034"),
        plot.subtitle = element_text(family=font1,
                                     color="white"),
        panel.grid.major = element_blank(),
        panel.grid.minor = element_blank(),
        axis.title.x = element_blank(),
        axis.title.y = element_blank(),
        axis.text.x = element_blank(),
        legend.position = "none",
        axis.text.y = element_text(color="#3d3d3d",
                                   family = font1,
                                   size = 20,
                                   hjust=0,
                                   margin = margin(l = 20,
                                                   r = -370))
  ) +
  scale_fill_manual(values = my_colors)

ggdraw() +
  draw_plot(p) +
  draw_image(file.path(here("cards.png")),
             x = -0.37, y = 0.35, scale = .175) +
draw_image(file.path(here("18plus_1.png")),
           x = 0.35, y = 0.35, scale = .175) +
  draw_text(text = "@leynu_ | Source: Kaggle by way of Board Games Geek",
            x=0.979,
            y=0.015,
            color="white",
            size=10,
            fontface = "italic",
            hjust = 1) +
  draw_text(text = "Year",
          x=0.127,
          y=0.056,
          color="white",
          size=14,
          hjust = 1) +
  draw_text(text = "The Name of the Game",
            x=0.33,
            y=0.056,
            color="white",
            size=14,
            hjust = 1) +
  draw_text(text = "Number of owners",
            x=0.488,
            y=0.056,
            color="white",
            size=14,
            hjust = 1) +
  draw_text(text = "Number of owners",
            x=0.488,
            y=0.056,
            color="white",
            size=14,
            hjust = 1) +
  draw_text(text = "Bayes average rating",
            x=0.76,
            y=0.08,
            color="white",
            size=14,
            hjust = 1) +
  draw_line(
      x = c(0.07, 0.09, 0.130),
      y = c(0.153, 0.04, 0.04),
      color = "white", size = 0.25
    ) +
draw_line(
  x = c(0.135, 0.155, 0.333),
  y = c(0.153, 0.04, 0.04),
  color = "white", size =0.25) +
draw_line(
  x = c(0.33, 0.35, 0.49),
  y = c(0.153, 0.04, 0.04),
  color = "white", size = 0.25
) +
  draw_line(
    x = c(0.583, 0.603, 0.77),
    y = c(0.153, 0.061, 0.061),
    color = "white", size = 0.25
  )

# Saving
ggsave("~/Desktop/board_games.png",
       width =12,
       height=8)